Download
main.cVoronoi diagrams
A while ago I wanted to do create some background graphics for this website, so I tried to generate some nice looking Voronoi diagrams. For a one off tool like this I think it's okay to take some shortcuts that might otherwise not be reasonable. So I used the Netpbm file format to output images, it is easy to use, quick to get going and requires a relatively small amount of code. My image viewer happens to support this format, but otherwise I could have used a commandline tool like 'convert' as an intermediate step before viewing the output.Getting set up
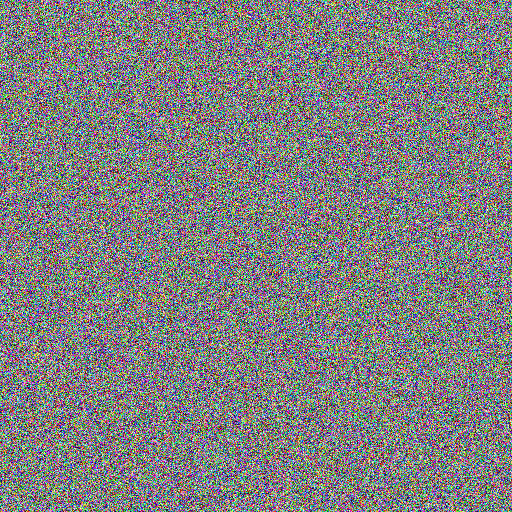
Let's start by creating a small program that does nothing more than create a 512x512 canvas, fills it with random colors and then writes it to disk. To compile and run the program all you should need to do is create a file named 'main.c', fill it with the code below and then run the following commands:$ gcc -o voronoi -Wall -Werror -O3 -lm main.c $ ./voronoi $ your_preffered_image_viewer output.ppm
#include <stdio.h>
#include <stdlib.h>

typedef struct {
  unsigned char r, g, b;
} RGBu8;

typedef struct {
  int width;
  int height;
  RGBu8 *pixels;
} Image;

// Write an image to a file using the binary PPM file format
static void image_to_ppm6(Image *img, const char *filename) {
  FILE *output = fopen(filename, "wb");
  if(output) {
    fprintf(output, "P6\n%d %d\n255\n", img->width, img->height);
    fwrite(img->pixels, sizeof(img->pixels[0]) * img->width * img->height, 1, output);
    fclose(output);
  }
}

int main(int argc, char *argv[]) {
  // Create a 512x512 canvas
  Image img;
  img.width = 512;
  img.height = 512;
  img.pixels = malloc(sizeof(img.pixels[0]) * img.width * img.height);

  // Iterate over every pixel on the canvas
  for(int y = 0; y < img.height; y++) {
    for(int x = 0; x < img.width; x++) {
      unsigned char r, g, b;
      r = rand() % 256;
      g = rand() % 256;
      b = rand() % 256;
      img.pixels[x+y*img.width] = (RGBu8){r, g, b};
    }
  }

  // Write the canvas to a file
  image_to_ppm6(&img, "output.ppm");
  return 0;
}
Randomly distributed points
To draw a voronoi diagram we'll need some points to define the voronoi cells. We create an array of 128 points and place them randomly within the bounds of the canvas. As a quick visualisation of these points we use an inefficient (but easy to write) algorithm. The algorithm iterates over all pixels in the canvas and for each pixel it iterates over all of the randomly generated points. If a pixel's coordinates within the canvas are the same as one of the randomly chosen points it will be colored white, otherwise it will be black.#include <math.h> ... typedef struct { float x, y; } Vec2; ... Vec2 points[128]; for(int i = 0; i < sizeof(points) / sizeof(points[0]); i++) { points[i].x = rand() / (float)RAND_MAX * img.width; points[i].y = rand() / (float)RAND_MAX * img.height; } ... for(int y = 0; y < img.height; y++) { for(int x = 0; x < img.width; x++) { unsigned char r, g, b; r = g = b = 0; for(int i = 0; i < sizeof(points) / sizeof(points[0]); i++) { if(x == roundf(points[i].x) && y == roundf(points[i].y)) { r = g = b = 255; } } img.pixels[x+y*img.width] = (RGBu8){r, g, b}; } }

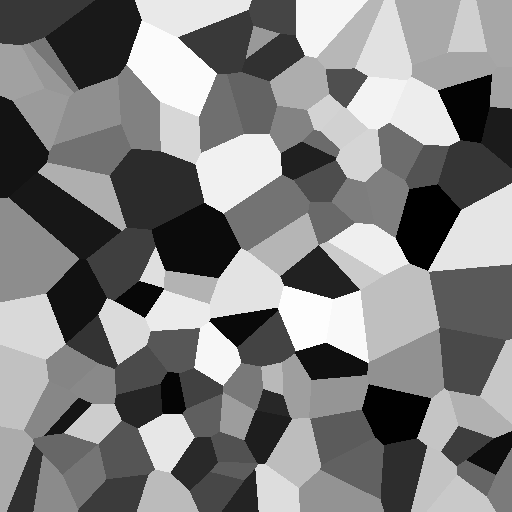
Basic Voronoi Diagram
Now that we have points to define the voronoi regions we can create a diagram. For every pixel in the canvas we iterate over all points and calculate the distance between them while keeping track of the one that has the smallest distance. When that is done we use the index of the point to calculate the pixel's color.#include <float.h> ... for(int y = 0; y < img.height; y++) { for(int x = 0; x < img.width; x++) { unsigned char r, g, b; int closest_point = -1; float smallest_distance = FLT_MAX; for(int i = 0; i < sizeof(points) / sizeof(points[0]); i++) { float dx = points[i].x - x; float dy = points[i].y - y; float distance = sqrtf(dx*dx+dy*dy); if(distance < smallest_distance) { smallest_distance = distance; closest_point = i; } } float color = (closest_point / (float)(sizeof(points)/sizeof(points[0]))); r = g = b = color * 255; img.pixels[x+y*img.width] = (RGBu8){r, g, b}; } }And that is all there is to creating a simple voronoi diagram from scratch using C. Now this is obviously not a remotely good looking diagram so I'll have to explore some other ways of rendering it.
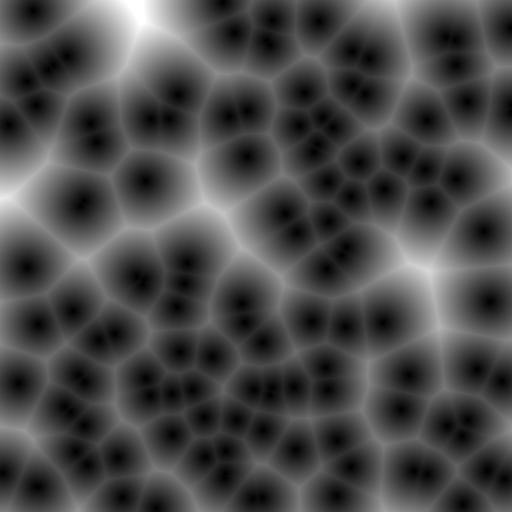
Coloring pixels by their distance to the closest point
Instead of using the index of the closest point to color a pixel we could use the distance itself. One reason using the index isn't very nice is because it changes abruptly at the edges of the voronoi cells causing aliasing. The distance on the other hand changes continuously (without any sudden large jumps in value) across the entire image.float color = smallest_distance / 80; if(color < 0) color = 0.0f; if(color > 1) color = 1.0f;
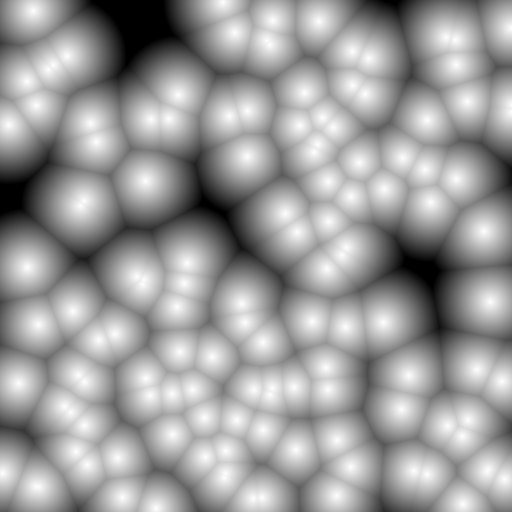
float color = 1.0f - smallest_distance / 60;
if(color < 0) color = 0.0f;
if(color > 1) color = 1.0f;
While these look interesting in their own right they do not really look like voronoi diagrams anymore. So maybe we can try something where the edges between the cells are more defined but transition in a continuous way. That's what we'll do next.
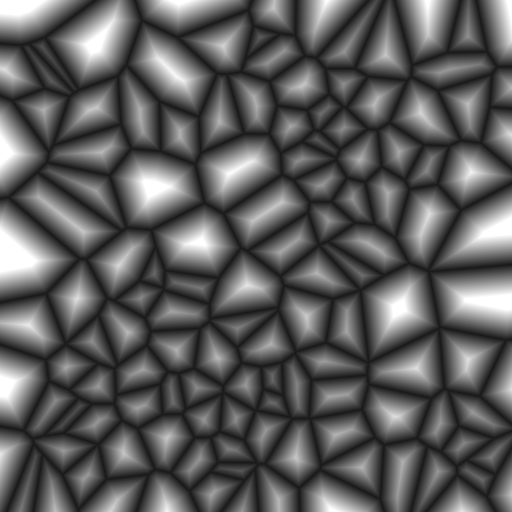
Coloring pixels by their distance to the closest edge
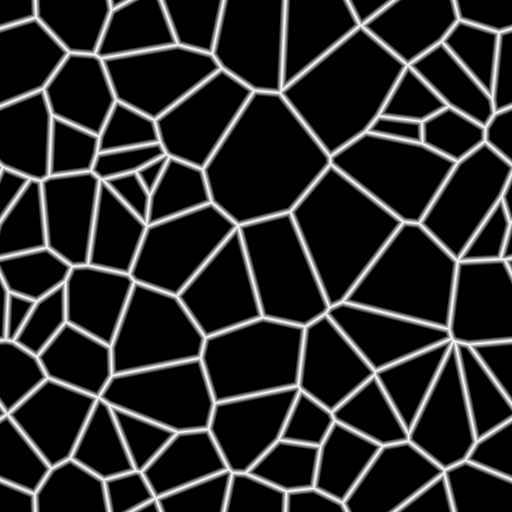
If we want to make sure the edges of the voronoi cells are easily discernable it would be nice to know what the distance of a pixel is to the closest edge of the voronoi cell it is in. This is a slightly more involved calculation than the distance calculation from before. First we need to know what defines the edges of a voronoi cell. The lines on which the edges of a voronoi cell lie are each defined by exactly two points p1,p2 (the point defining the voronoi cells) in the diagram. In fact every point on these lines is equidistant to those two points p1 and p2. This is the dotted line in the diagram below, also displayed in the diagram is m the midpoint inbetween p1 and p2 which lies on the dotted line.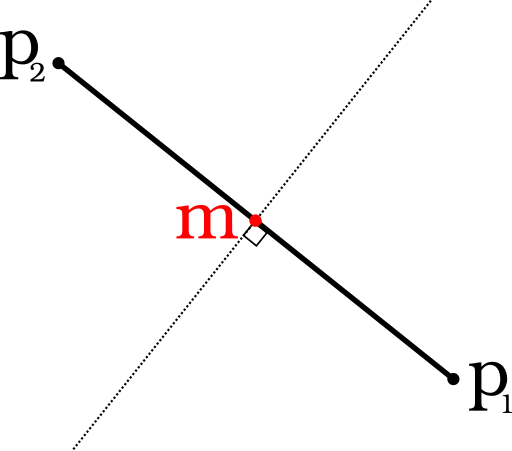
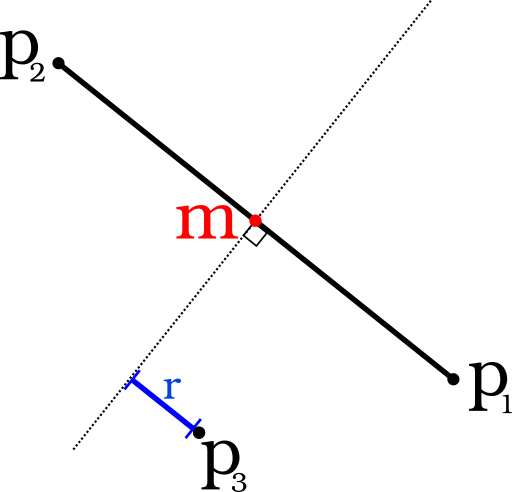

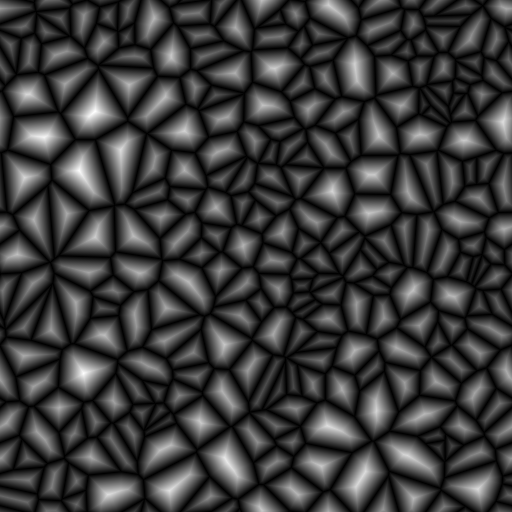
float closest_edge_distance = FLT_MAX;
for(int i = 0; i < sizeof(points) / sizeof(points[0]); i++) {

  float midpoint_x = (points[closest_point].x + points[i].x) / 2.0f;
  float midpoint_y = (points[closest_point].y + points[i].y) / 2.0f;

  float m_p3_x = x - midpoint_x;
  float m_p3_y = y - midpoint_y;

  float m_p1_x = points[closest_point].x - midpoint_x;
  float m_p1_y = points[closest_point].y - midpoint_y;

  float len_m_p1 = sqrtf(m_p1_x*m_p1_x + m_p1_y*m_p1_y);
  float unit_dx = m_p1_x / len_m_p1;
  float unit_dy = m_p1_y / len_m_p1;

  float proj = m_p3_x * unit_dx + m_p3_y * unit_dy;

  if(proj < closest_edge_distance) {
    closest_edge_distance = proj;
  }
}

float color = 0.1 + 0.9 * (closest_edge_distance / 30.0f);
if(color < 0) color = 0.0f;
if(color > 1) color = 1.0f;
Now we have rendered the voronoi cells with clearly defined edges while also avoiding the aliasing that occured in our first attempt. There are all sorts of small variations possible, some of which I've displayed below.
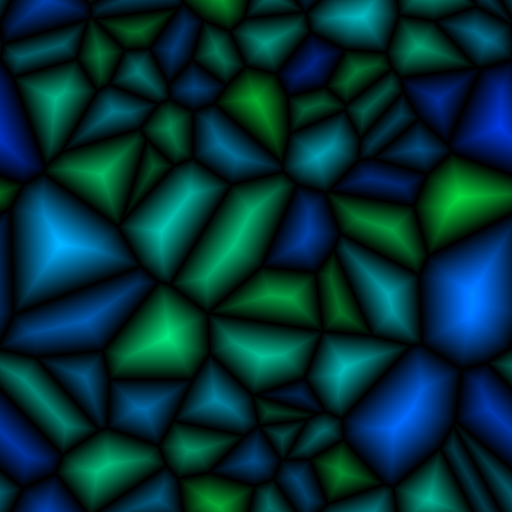
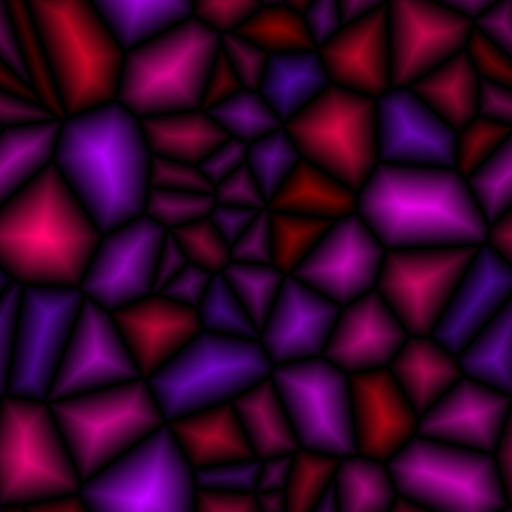
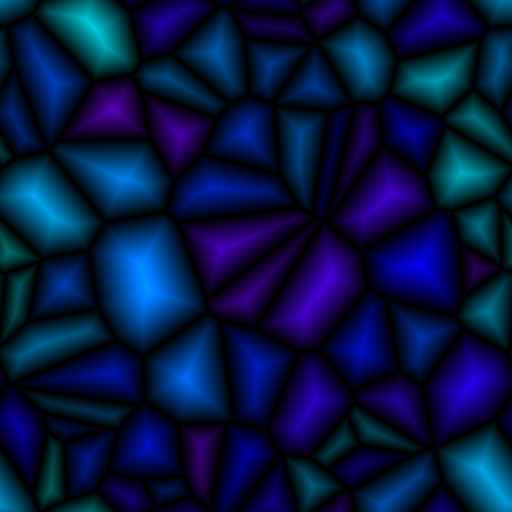
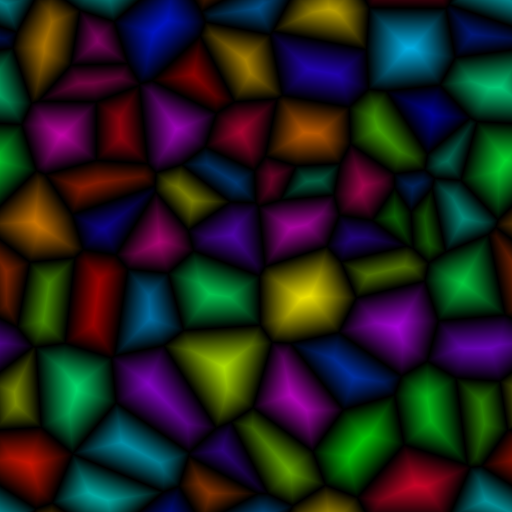
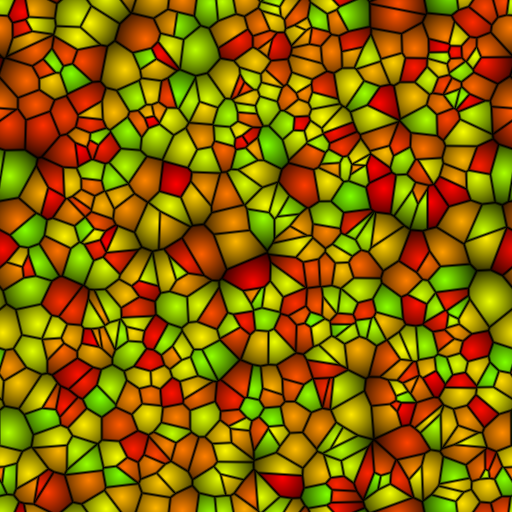
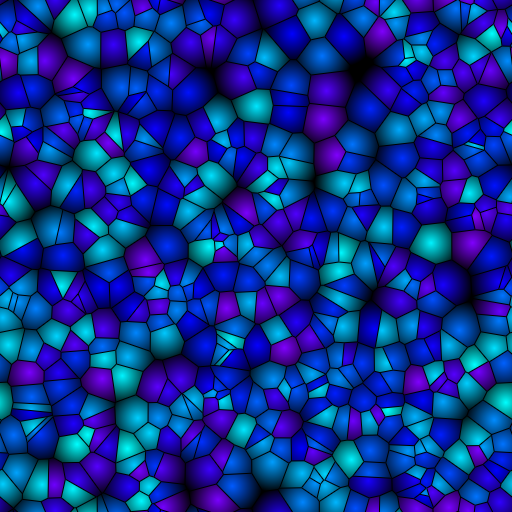
Gallery
References
[1] Voronoi diagrams[2] Netpbm
[3] Scalar projection